This week I want to talk about what has gone into the creation of the maps that are illustrated in The Roof at the Bottom of the World. The base maps were produced by the U. S. Geological Survey after the International Geophysical Year (1957-1958), in a rush of activity that charted the entire length of the Transantarctic Mountains at a scale of 1:250,000. Combining aerial photography with ground control, the first printed quadrangles were published in 1959. Topographic engineers who created the initial ground control accompanied overland traverses or utilized helicopter support in coastal areas. Over the next five years, six to eight new maps were added annually to the portfolio of the Transantarctic Mountains. In 1964, the Topographic Division produced an astonishing twenty-four 1:250,000 sheets, covering all the bedrock outcrops of the Transantarctic Mountains, except for five quadrangles, which were published the following year. This bonanza followed a remarkable pair of seasons (1961-1962 and 1962-1963), during which a crew of topographers supported by a pair of Army helicopters surveyed the entire 1,500-mile length of the Transantarctic Mountains. In the book, I tell the story of these campaigns for the first time.
During the period of peak productivity, the personnel at the Topographic Division assigned to the Antarctic quadrangles grew to about 180 participants. The teams split the tasks that included careful measurement and marking of peaks on aerial photos, linking summits to ground control, transferring points to a scribe sheet, measuring and drafting in contour lines, distinguishing ice from rock, adding color, outlining crevasse fields and moraines, air-brushing shaded relief, and inserting geographic names–all the while checking and rechecking everything for accuracy. The contour interval (the elevation difference between lines on the map) of these maps is 200 meters. This interval is very coarse when it comes to reckoning on the ground, but cartographers added air-brushed, shaded relief depicting the landscape to a detail that far surpasses that which can be read from the contour lines alone. With burnt siena bedrock, pale blue ice, and the sun perpetually shining in a northwestern sky, the air-brush rendering has provided a magnificent base map for tracing of the routes of the explorers, showing precisely where they traveled into the mountains, through crevasse fields, around ridges, over passes, up outlet glaciers, and onto the polar plateau.
In the 1990’s the USGS scanned all of the 1:250,000 quadrangles into digital format and made them available to the public.

Franklin Island Quadrangle, 1:250,000, U. S. Geological Survey. Note that only the southwestern corner of the quadrangle was used.
For the figures in the book I merged those quadrangles that covered the area that I wanted to show. The USGS provides digital copies of the quads with both the margins intact and with them stripped away so that one can collage the quads seamlessly. But even though the merger is quite exact, the colors of the original, printed maps varied in some cases, so this shows up in the scans.

The Granite Harbour area combining four quadrangles, clockwise from upper left: Convoy Range, Franklin Island, Ross Island, and Taylor Glacier.
Once the collage was complete, I cropped the map to the size that I wanted. The next step was to Photoshop out all of the geographical names, producing a clean base upon which to work.

Granite Harbour area, cropped and geographic names removed.
Next I re-inserted names for those places mentioned in the book.

Granite Harbour area with geographic names re-inserted. Note that the outline of the Mackay Glacier Tongue shows its size in 1910-11 according to the map by Taylor that follows.
Finally, I drew in the traverse routes of the explorers using Adobe Illustrator. In some cases I composed the routes by a careful reading of the original accounts, but in others I was able to follow maps made by the explorers that showed the routes they took; for example, the map that follows by Griffith Taylor.

Granite Harbour area with explorers' routes and legend. The missing line on the left side of the Legend was corrected during final editing at Yale University Press.

Granite Harbour as mapped by Griffith Taylor following exploration during the 1911-12 field season.
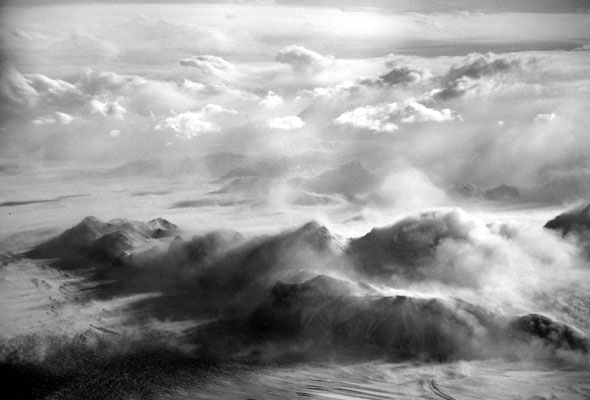
Gallery – Zipper Ice
Straddling the boundary between northern and southern Victoria Land, Terra Nova Bay is home to open water during a longer period of the year than anywhere else along the Victoria Land coast. This is due to persistent katabatic winds (cold, gravity-driven winds) that pour down David Glacier and open the bay. In November of 1980, I observed an unusual phenomenon in this area. A thin sheet of ice had recently frozen over the open water. (I don’t know how thick, since we were at about 30,000 feet, but probably only a foot or two at most.) Some sort of pressure (currents or wind?) pushed the ice to the point of fracturing, but instead of a clean line with one side of the ice overriding the other, in this case each side took turns at being the one that rode over the other. I have heard this called “zipper ice,” though a quick trip to Google produced no hits for this feature. If you have a reference to zipper ice or have seen it let me know.